Latest News
NEW Condominiums in Tokyo, 6260000 Yen per Unit
2022/1/28
Urban Planning and Redevelopment Area Information
An Investigation into Market Trends for New Condominiums announced by Real Estate Economic Institute, revealing the market trends for new condominiums in the Tokyo metropolitan area for 2021 on January 25

Summary of the Tokyo Metropolitan Area New Condominium Market Trends for 2021
・Survey areas:Tokyo、Kanagawa Prefecture、Saitama Prefecture、Chiba Prefecture (1 metropolis and 3 prefectures)
◎33,636 units were released, a 23.55% increase from the previous year, making a return to the 30,000-unit range for the first time in two years.
◎Average price: 62,600,000 yen. Price per square meter: 936,000 yen. Both figures have reached new highs.
◎Initial monthly contract rate is 73.3%, exceeding 70% for the first time in six years since 2015.
◎For 2022, 3,4000 units are projected, with notable large scale properties expected to be launched from the spring sales season.

1.Number of Units Released
The number of units released was 33,636, a 23.5% increase from the previous year (27,228 units). (The highest number ever was 95,635 units in 2000.)
【Breakdown by Area】
・Tokyo 23 Wards:13,290 units(39.5% share)
・Tokyo Suburbs:2,921 units(8.7% share)
・Kanagawa Prefecture:8,609 units(25.6% share)
・Saitama Prefecture:4,451units(13.2% share)
・Chiba Prefecture:4,365units(13.0% share)
2.Contract Rate
The initial monthly contract rate was 73.3%, up 7.3 points from the previous year (66.0%). It is the first time in six years since 2015 that the rate exceeded 70%.
【Breakdown by Area】
・Tokyo 23 Wards:72.5%(up 6.3 points from the previous year)
・Tokyo Suburbs:74.8%(up 25.2 points from the previous year)
・Kanagawa Prefecture:71.8%(up 1.8 points from the previous year)
・Saitama Prefecture:70.6%(up 9.4 points from the previous year)
・Chiba Prefecture:80.3%(up 3.4 points from the previous year)
3.Average Price and Price per Square Meter
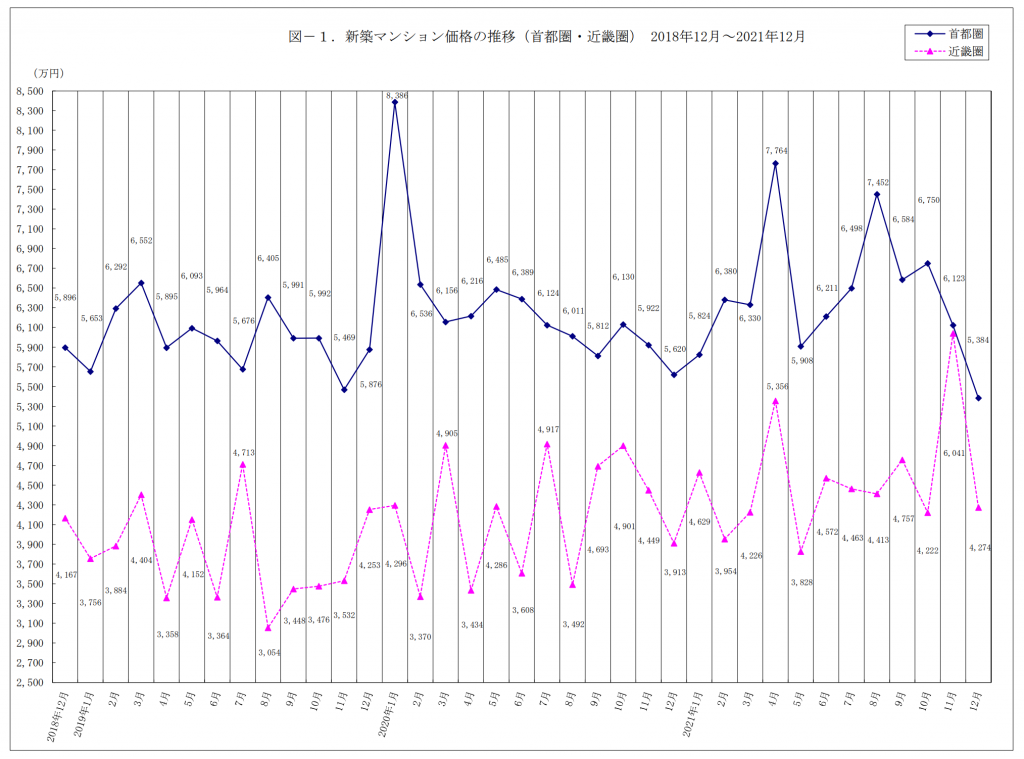
The average price of new condominiums in the Tokyo metropolitan area(Tokyo、Kanagawa、Saitama、Chiba)in 2021 was 62,600,000 yen(up 2.9% year-on-year), and the price per square meter was 936,000 yen (up 1.2% year-on-year).
The average price has increased for three consecutive years, surpassing the 1990’s record of 61,230,000 yen, and the price per square meter has increased for nine consecutive years, surpassing the 1990’s record of 934,000 yen. Both have set new highs.
【Breakdown by Area】
・Tokyo 23 Wards:82,930,000 yen・1,282,000 yen (up7.5% and 2.5% from the previous year)
・Tokyo Suburbs:50,610,000 yen・741,000 yen(down 7.3% and down 8.0% from the previous year)
・Kanagawa Prefecture:52,700,000 yen・780,000 yen (down 3.1% and down 4.6% from the previous year)
・Saitama Prefecture:48,010,000 yen・707,000 yen (up 5.2% and up 6.0% from the previous year)
・Saitama Prefecture:43,140,000 yen (down 1.4% and down 0.8%)
4.Sales Inventory and Characteristics
As of the end of December 2021, there were 6,848 units in inventory, a decrease of 2,057 units from the end of December 2020 (8,905 units).
The number of units released exceeded 30,000 for the first time in two years. The initial monthly contract rates exceeded 70% across all areas, indicating a favorable market. Based on these, the year-end inventory of 6,848 units was the lowest since 6,431 units in 2015.

5.Other Topics
The number of luxury condos (those with a selling price of over 100 million yen) was 2,760 units, an increase of 942 units (51.8%) compared to the previous year (1,818 units). (The highest number is 3,079 units in 1990.) The highest price was 1,370,000,000 yen for the ‘Park Court Jingu Kita-Sando The Tower’ (with a floor area of 238.55 square meters)
In terms of properties sold out on the same day, 1,347 units (4.0% share) were sold in 2021, compared to 427 units (1.6% share) in 2020. This indicates that the sales of high-priced properties in 2021 were better than those in the COVID-19 pandemic year of 2020.
The number of properties registered with the Flat 35 loan was 30,917 units, with a 91.9% share, showing an increase from 25,729 units and a 94.5% share in 2020. This suggests that the market was more active in 2021 compared to the pandemic year of 2020. The decrease in share in 2021 compared to 2020 is likely due to changes in the ratio of high-end luxury condo sales and the total number of units released annually.
◎Summary of the Tokyo Metropolitan Area New Condominium Market Trends for 2021
https://www.fudousankeizai.co.jp/share/mansion/493/s2021.pdf
For more information
